Macro update
What rising yields do to stocks
Brian "Fuzz" Farr · · 9 min read

As July came to a close, something quite interesting occurred in the 30-year Treasury yield and the others. The 30-year yield closed at a fresh cycle high of 5.28%. If we look at the other yields, the 20-year yield sits higher at 5.28%, and the 10-year at 4.74%, which is the most since January of 2025. The Federal Reserve held rates steady, so this wasn’t their doing. The long end did this on its own and it is something we should be monitoring and paying attention to. We are going to start here and work our way out.
Trade Live with me at Stock Dads
Let’s look at where the pressure is on the yield curve and discuss what the Fed does and doesn’t set. The Federal Reserve sets one thing directly, which is the overnight fed funds rate. The 2-year yield isn’t set by the Fed, but it does hug the path that the market expects the rate to take. When we watch the 2-year yield we are watching its maturity closest to Fed policy, and it currently sits at 4.26%. The current federal funds rate is at 3.5%-3.75%. The 10-year yield is at 4.74%, with the 20-year and 30-year yields both over 5.25%. These long maturities move on free-market forces such as growth, inflation expectations, and the size of the deficit. When the long end rises faster than the Fed-anchored short end, we call it a bear steepener. Right now, it is pointing at something bigger than the next rate decision, and that is what investors demand to lend to the government for twenty and thirty years.
The current demand is going up for reasons that don’t reverse on one data print. The United States has heavy deficits alongside an economy with near full employment. There is also a wall of new bonds to sell, and not to mention a Fed chair that has stepped back from guiding the market. Griffin Ardern at Primal Fund has framed it well, calling it a “re-rating of Treasuries rather than a rate cycle, with the long end carrying almost all of the premium.”
Two tells show he is onto something. The first is that the dollar fell this week even as yields climbed. If the world was scrambling for dollars, the dollar would be rising. Because it fell, this points the finger at our own fiscal picture and not a global squeeze. The second thing, which may be more interesting, is that the bond hedge stopped working. When Kevin Warsh finished his press conference, stocks fell, and yields rose together. Bonds are supposed to cushion a stock selloff, but right now they are adding to it, and that breaks the 60/40 math that a lot of portfolios still run on.
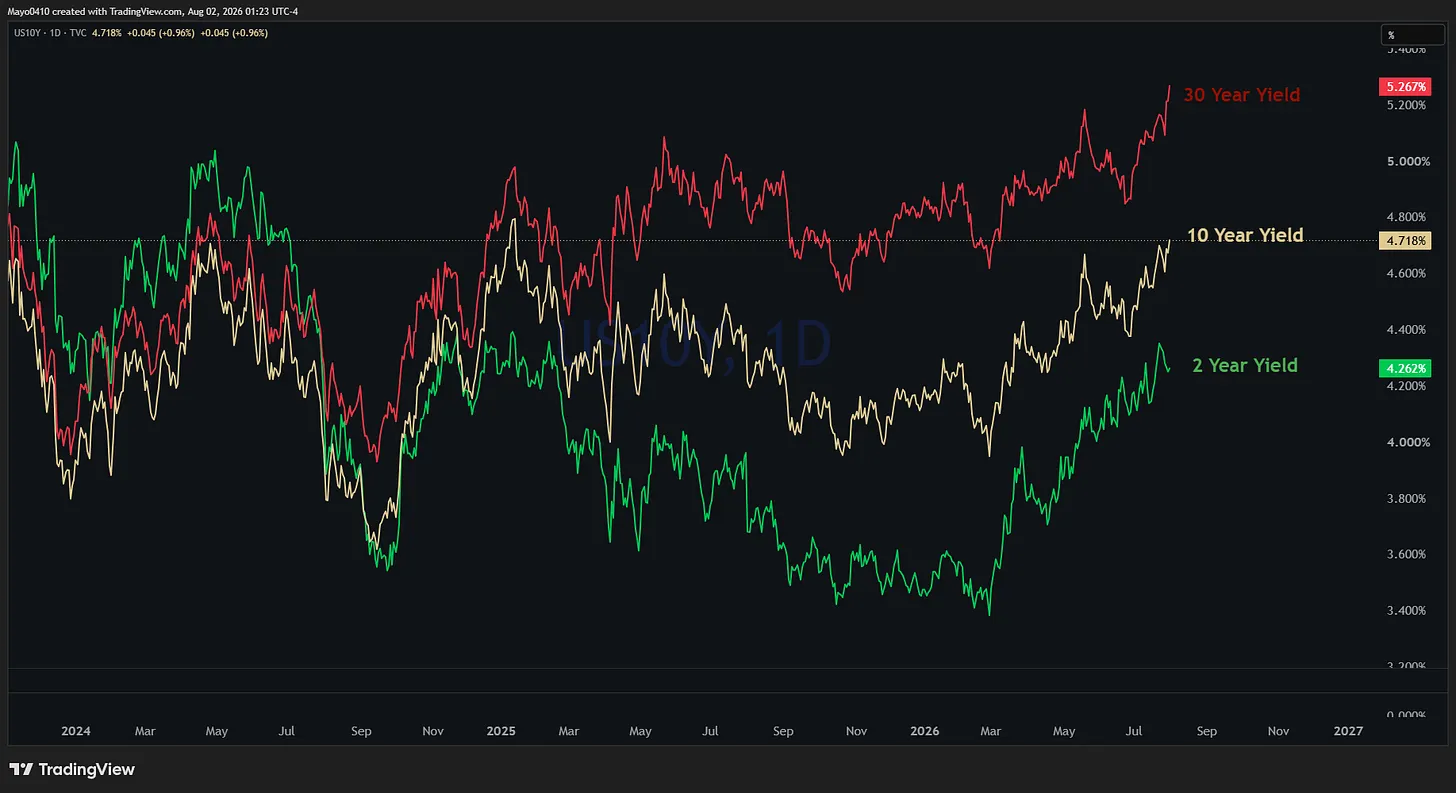
30-year and 10 year-yields while the 2-year lags. This is the Bear Steepener.
Why the yields move your stocks
There are two important matters here. The first is a matter of competition. Let’s think about that. When the 30-year yield rises, and bonds pay you over 5% to take almost no risk, stock investments have to work harder in order to look worth it. That makes the demand for holding equities shrink, and money shifts toward the safer yield. Nathan Peterson from Schwab said that he is not sure how bullish he can be with yields rising, because higher yields are restrictive and compress equity premium.
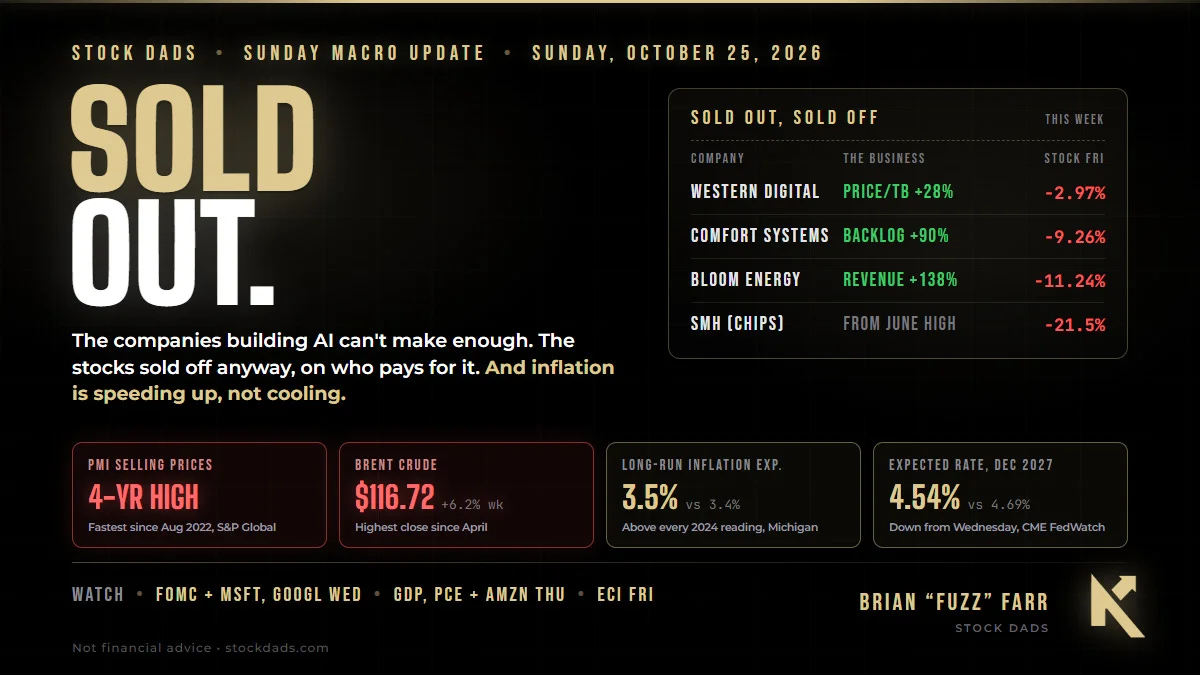
The second matter to discuss here is the cost of AI buildout. Higher long-end yields raise the rate on the debt that funds every data center and chip order. We saw in July that that is not an abstraction. Even an AI hedge fund called Situational Awareness blew up on borrowed money in semis and got bought up by Citadel. South Korea’s stock market fell 10% in two days before a record snap-back. These are the sounds of over-leveraged trades getting unwound as the AI names fall. Though higher yields are not the sole cause, they do raise the cost to borrow money that the whole trade is even built on. So rates sit upstream of it all.
Still a rotation story
We are entering a new month, so I pulled out the monthly timeframes for the bigger picture read. It’s an important context before anyone even panics. Almost everything that I track is still trading above its long-term monthly moving averages. We are still in a multi-year uptrend in the S&P, the Dow Jones, and small caps, and the cyclical sectors have not broken. That in itself is the difference between a leadership change nd a market top. Right now, the evidence points to a leadership change.
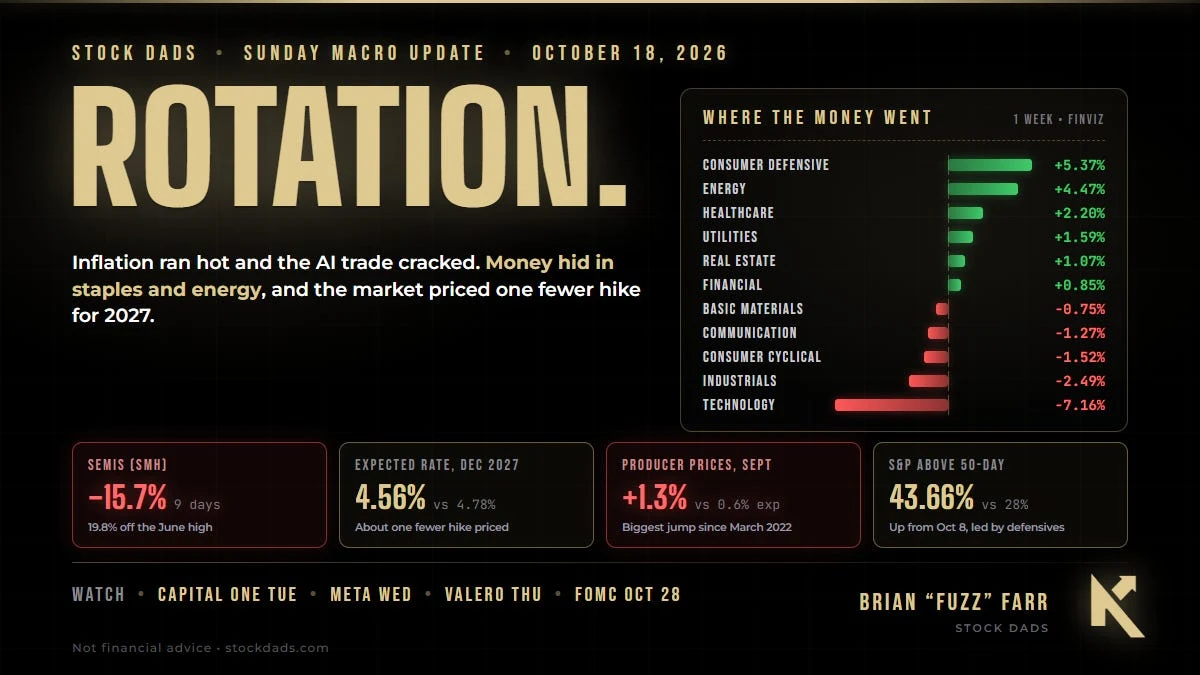
There has been a change in momentum, and it is split cleanly. Cyclicals and defensive groups are as strong as they can get. This includes the Dow Jones, small caps, materials, staples, real estate, regional banks, and transports. They are all reading maximum strength and sitting well above every moving average. Energy, healthcare, and financials are close behind. Growth is where momentum has cooled. The Nasdaq, semiconductors, software, and communications are still above their long-running averages, but their momentum has cooled. And I am sure you have felt that, especially if you are growth and tech heavy. But the healthy market right now is the boring one.
This is my monthly scoreboard on the main SPDR Sectors:
Strong: XLB, XLP, XLRE, XLV, XLE, XLF
Neutral: XLK, XLU, XLI
Weak: XLY, XLC
If you read just that itself, you will notice that the rotation speaks for itself. Money right now is in defensives and hard assets, while growth and the consumer end of the market are where the momentum has drained.
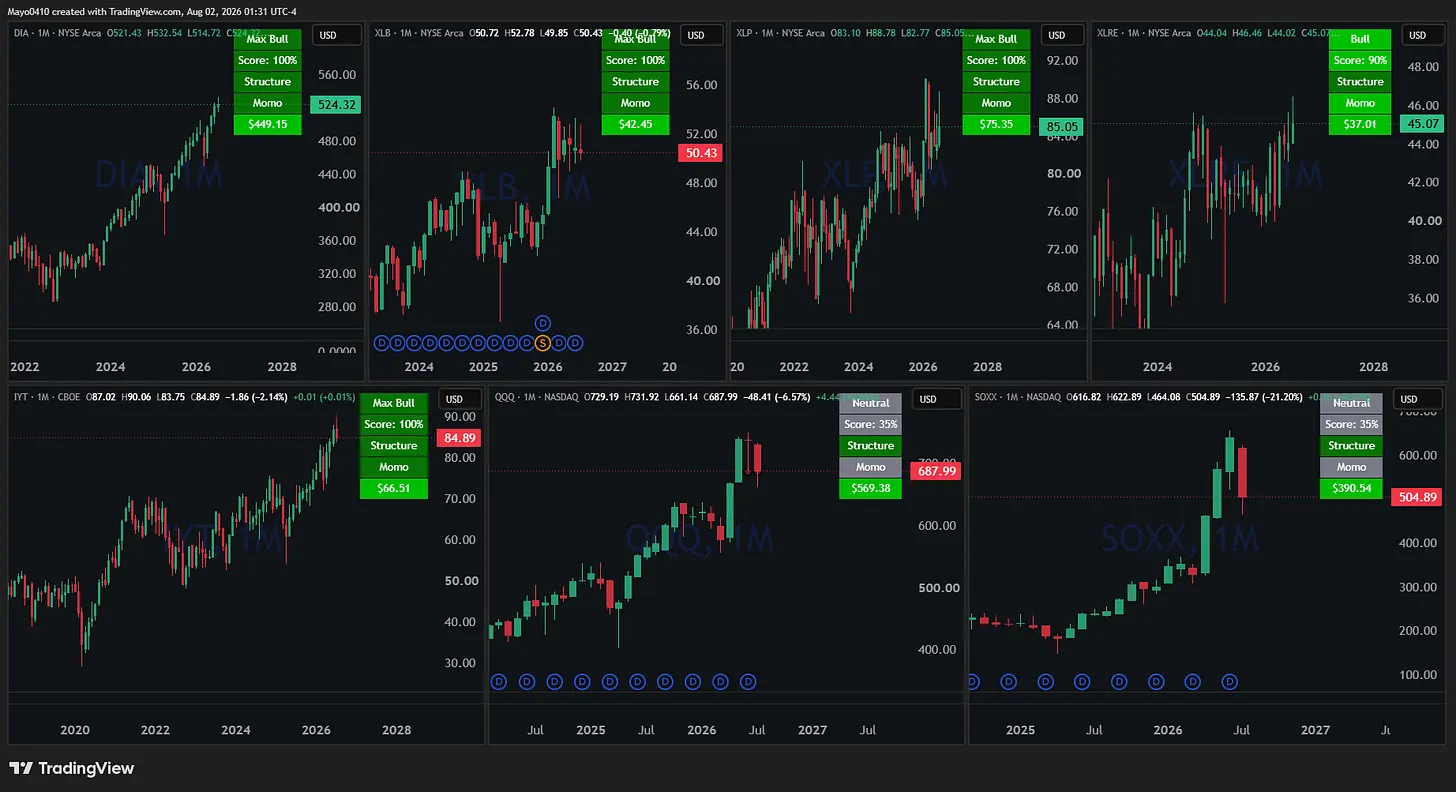
Monthly Sector View showing the Dow Jones, materials, staples, real estate, and transports versus the Nasdaq and Semiconductors.
SPY and QQQ
Plain and simple here: The S&P is holding up better. When we look at the monthly and weekly timeframes, we can see that she remains above every moving average. She even remains just shy of its all-time high. The uptrend is still intact. But it is stretched. The monthly momentum readings are at the top of their range. And it’s the kind of extended reading that doesn’t have to break, but it does only leave a little room for error. On the daily, price is still above its 8, 21, and 50-day moving averages thanks to Thursday and Friday’s bounce. I am watching the $727-$725 shelf. So far, it has held twice, so that is my line that will decide whether this stays a grind or turns into something deeper. Below that, the daily 200 SMA sits near the psychological level of $700.
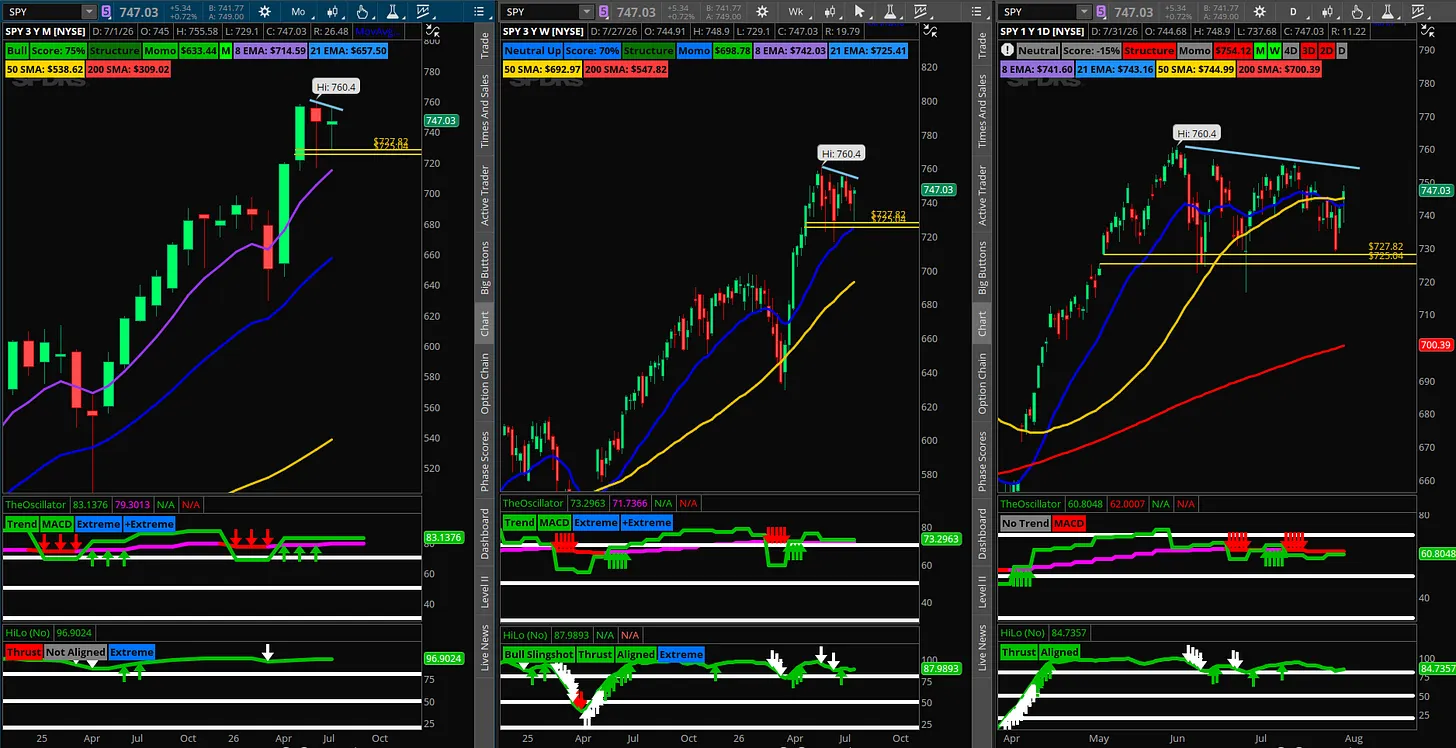
SPY monthly, weekly, and daily. SPY is holding above its moving averages and near its highs.
The QQQ is more on the weaker side. She closed under her weekly 8 EMA and under the $702 level that had been support. On the daily, it has bounced but is stuck below its 21 EMA and 50 SMA. MSFT and AMZN earnings lifted tech, but the QQQ has yet to repair the damage in the way that SPY has. The gap between these two is the rotation in one picture. SPY has the cyclical ballast, whereas the tech-heavy QQQ does not.
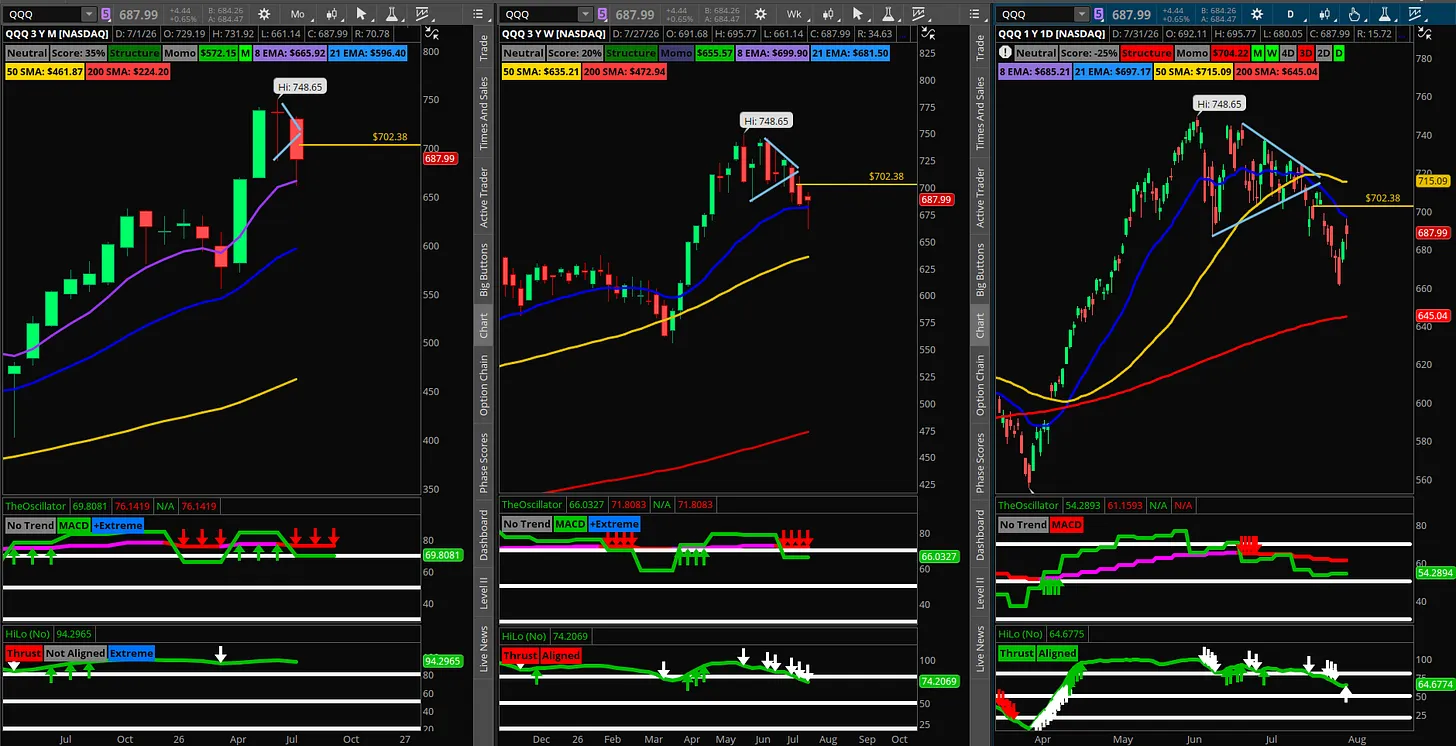
QQQ monthly, weekly, and daily view. QQQ is under its weekly 8 EMA, but holding its weekly 21 EMA. The daily shows the momentum shift and is wedged between the 21 EMA and 200 SMA.
Which leads me to discuss the tension in the room. When the Fed held, and the long-end yields spiked, the Dow Jones fell more than 1,000 points. Thursday and Friday, tech ripped back. MSFT and AMZN jumped more than 15% due to their cloud numbers, which put the AI-spending worry back to bed. The monetization question got a strong answer even as the funding cost also got louder. Things weren’t clean, though. AAPL fell 7.4% on Friday, which was its worst day in over a year. The Semiconductor Index closed out July down more than 20%. Thats it’s worst month since 2008. Earnings across the board have been stunning, with nearly 70% of names that have reported so far beating on revenue and 86% beating on the bottom line. But we have seen sour reactions and good numbers getting sold. This is what the tape does when it is worried about the cost of money instead of the quality of the business.
Credit still wavering
I have been talking about this for weeks, so you may know what is coming next. Investment-grade credit, LQD, is still below all of its monthly moving averages with negative momentum. High-yield junk bonds, HYG, are still soft and remain under their near-term monthly averages. When the long end is repricing, and credit won’t even firm up, the market is telling us that the cushion under risk assets is thinner than the index level suggests. This is simply a headwind.
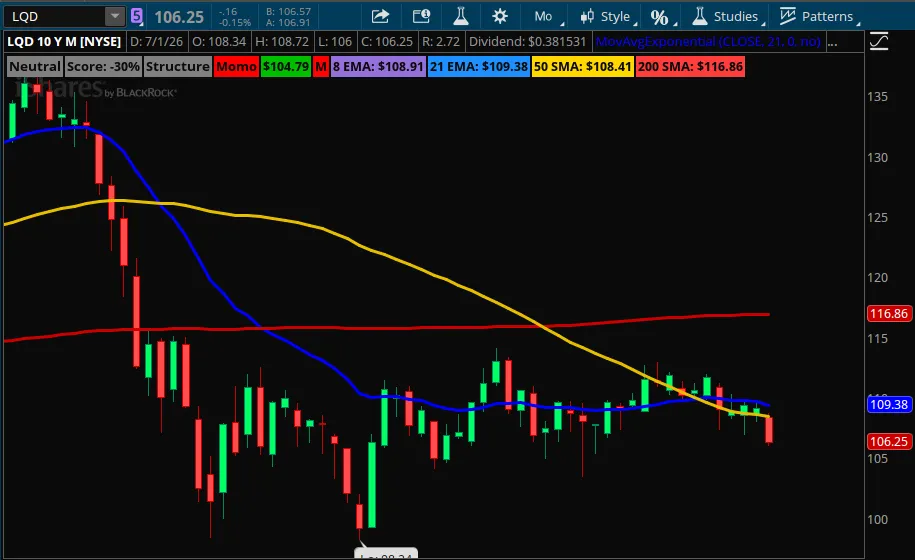
LQD, which is the investment-grade corporate bonds, is still below its key moving averages. This shows us that credit is not confirming the equity bounce.
Oil and energy costs are adding pressure
We continue to see back-and-forth moves in the Middle East. Crude pulled back about 5% this past week to around $85. Pressure is still here, and oil remains a two-way risk that feeds right back into the inflation and yield story. If we get lower oil next week, that will take pressure off yields and can give stocks some room to breathe. Higher oil will do the opposite.
How I am navigating
I still carry longer-dated SPY puts that I put on a few weeks ago. I am still cash-heavy. Sure, I am nibbling here and there, and I am day trading as opportunities arise. But I am not being aggressive, because the signals that I have just described to you tell me not to be aggressive. If SPY breaks out of its consolidation to the upside and out of a higher time-frame bull flag, that is when I will take off my hedges and begin to be more aggressive. I will also want yields to come right back down. The monthly trends are up, and breadth is still positive. Over 65% of names in the S&P 500 are above both their 50-day and 200-day moving averages, and the equal-weight RSP continues to grind higher. We shouldn’t be calling for a top or a market crash. That is naive. We do want to respect the tape, size accordingly, and let the market prove which way it wants to resolve.
Terry Sandven at US Bancorp flagged the 10-year at 5% as the one that will start pressuring valuations in earnest. So I will also be watching that yield this week. We have a jobs report coming up on Friday, which could be the first read that could move the needle for the Fed’s September rate decision. I am also paying attention to tech this week on whether it can follow through or stall out. Seasonality speaking, August and September are historically the roughest stretch of the year.
If you’ve taken away anything from this write-up, I hope it is the one on why bonds and yields are so important right now. As yields continue to rise, it makes assets less appealing. This is what August is going to be about.
Brian Stock Dads
This analysis uses a proprietary multi-timeframe indicator system combining trend oscillators, stochastic momentum readings, moving average structure scoring, and volatility compression analysis. All readings are based on August 1, 2026, closing prices. Not Financial Advice.
Trade alongside our analysts
Join the 1%