Macro update
Patience
Brian "Fuzz" Farr · · 20 min read

The short and sweet version
The Fed is almost certain to do nothing at its October 27-28 meeting. Odds of a rate hike fell from 50/50 to 18% after Friday’s weak jobs report.
Long-term interest rates are rising anyway. The 30-year Treasury hit a fresh cycle high last week, and the 10-year is up half a percentage point in a month.
Those two facts belong together. A Fed that won’t fight this inflation is a Fed that will live with more of it, and investors want to be paid extra to lend for thirty years into that.
Companies are paying more to borrow, and since September 23 it’s coming from two directions. Rising Treasury yields have been lifting corporate borrowing costs all year. What’s new is the extra premium charged specifically to riskier borrowers, which went nowhere for three months and has climbed every trading day since September 23. That second part started before the Fed speakers turned hawkish and well before Friday’s jobs report, so it isn’t a reaction to either.
Higher long-term rates do the same job a rate hike does, except nobody steers where they land. They’re landing on utilities, real estate, small companies, and the bottom fifth of earners, who spend 17% of their income on energy.
If you read nothing else, that’s the week. The rest is the evidence.
High-yield spreads have gone from 268 basis points on September 22 to 324 as of October 1. This number is what a risky company pays in order to borrow over and above what the US government pays. A basis point is one-hundredth of a percent, so the premium rose from 2.68% to 3.24% in just seven trading sessions. That’s a 21% increase in borrowing costs for every company in that bucket. This began a few days before the Fed speakers turned hawkish and nine days before Friday’s jobs report, which means credit wasn’t reacting to either one. It has been reacting to long-term Treasury yields. Everything else this week sits downstream of this.
Doves were handed everything, yet yields rose
Friday’s jobs report was soft in every important line. Nonfarm payrolls came in at 29,000 against a consensus near 89,000. July was revised from +21,000 to -10,000. August was also revised down from 162,000 to 133,000. This makes the past two months combined 60,000 lower than previously reported.
Average hourly earnings rose 0.1%, half the expected pace, putting the twelve-month rate at 3.0%. The three-month annualized pace is 2.36%, the lowest since March 2021.
Core PCE on a three-month annualized basis is running at 2.05%. So, the labor market is adding fewer jobs than it needs to hold the unemployment rate flat, wage growth is decelerating in a straight line, and core inflation is running at 2% annualized.
October rate-hike odds fell from a 50/50 split to 18% on Friday. Yet the long end of the yield curve made fresh cycle highs anyway.
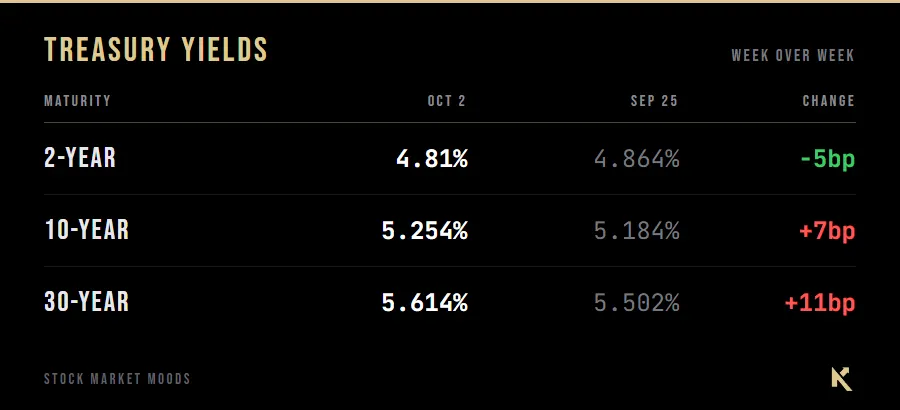
The 10-year touched 5.342% on Thursday and is up half a percentage point over the past month. The gap between the 2-year and the 30-year widened by 17 basis points on the week, to 80.
We need to read the short and long ends separately, because they say different things. The 2-year tracks what the Fed does over the next year or two. The 30-year tracks what investors think inflation and government borrowing will look like for a generation. The 2-year fell because rate hikes got priced out. The 30-year yield rose because the market has decided that the Fed won’t hike into 3.4% headline inflation and will tolerate more inflation for longer.
The confirmation is in the cut pricing. Expectations for cuts between now and September 2027 went from 3.5 to 3.3 this week. On a week with a 29,000 payroll print, the market removed hike risk and cut expectations at the same time. That only makes sense one way. This isn’t a growth scare. It’s a repricing of what the Fed will put up with.
What the committee actually forecast
Four times a year, the Fed publishes what every member expects the economy to do, called the Summary of Economic Projections. September’s edition is worth the read, because it’s the look-through doctrine written down in numbers. “Looking through” a shock means ignoring it, on the theory that it’ll pass before any rate move could do anything about it.
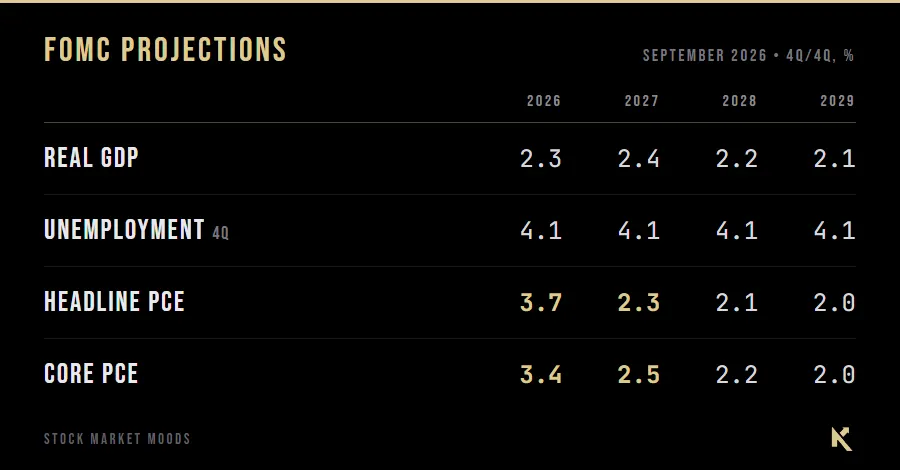
Headline inflation falls 140 basis points in twelve months. Growth holds at 2.4% and unemployment never moves off 4.1%, not in 2027 through 2029. That’s an oil shock passing through the data with no labor market cost. But they’re already off because September printed 4.2% unemployment.
Crude is still well above where it sat a year ago, which is why energy is pushing inflation up today. But that math unwinds on its own. Inflation is always measured against the same month a year earlier, so once this spring’s spike rolls out of the comparison, the energy contributions fall even if oil doesn’t move another dollar. Economists call this the base effect. The committee’s forecast of headline inflation dropping from 3.7% to 2.3% is a monthly base-effect call, and base-effect calls usually work. What crude falling doesn’t do is settle the energy question, because crude isn’t where the squeeze is. Distillate is the refined product you get from a barrel of crude that becomes diesel and heating oil. It shares refining capacity with jet fuel, and its a separate market from gasoline.
Commercial crude inventories are actually higher than a year ago. Distillate is down 15%, ultra-low sulfur diesel is down 16%, and it drew another 2.3 million barrels that week as we head into the heating season. Refineries ran 3.2% more crude than they did a year ago on a four=week basis and distillate stocks fell. Crude is in surplus. Distillate is in a deficit.
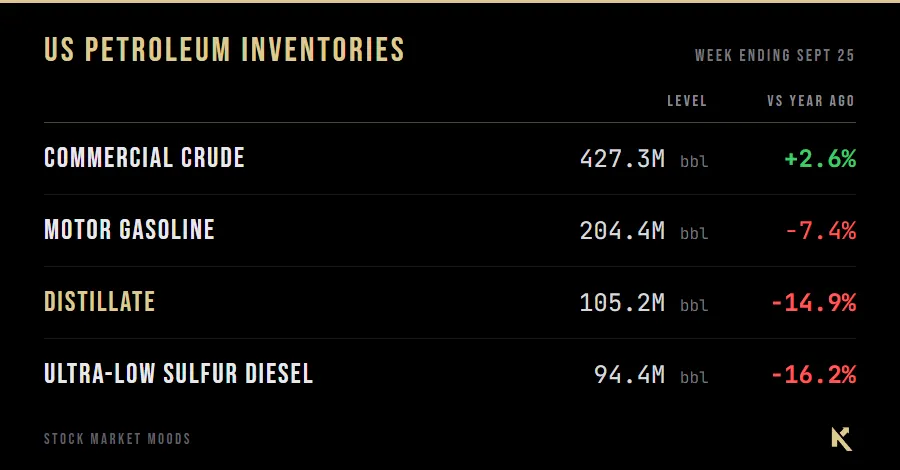
At the pump, on-highway diesel is $6.382 a gallon, up $2.628 from a year ago, which is 70%. Regular gasoline is $4.465, up $1.347, which is 43%. The diesel premium over gasoline is $1.92 a gallon, up from 64 cents a year, nearly tripled.
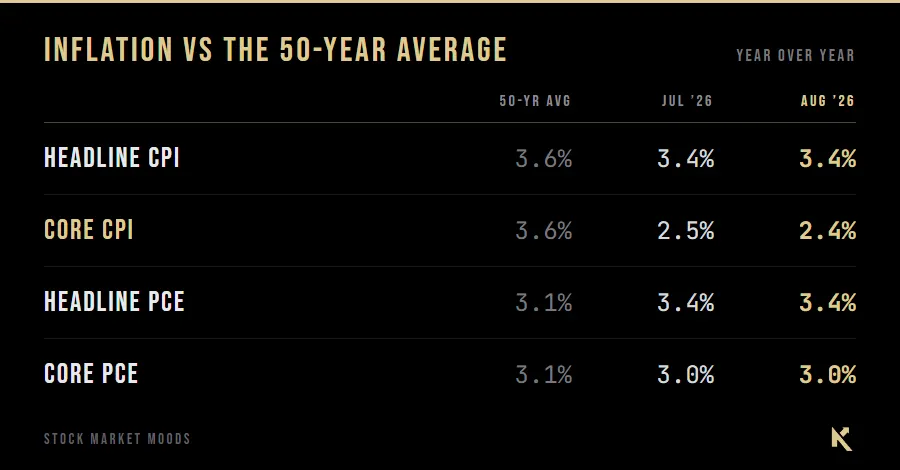
This is the shock. It’s the refinery, as I have mentioned in prior writings. And diesel fuels freight, rail, agriculture, construction, and home heating, which is why it shows up in thirty or forty other line items in a way gasoline doesn’t. The hard part of the table above isn’t the headline row. It’s core going from 3.4% to 2.5% while unemployment never leaves 4.1%. No base effect does that, and a 70% move in the fuel that moves everything else is the mechanism that keeps it from happening.
This is why the dissent from the regional Fed presidents matters. Goolsbee and Musalem aren’t making an abstract argument about supply shocks. They’re saying the committee’s own forecast from three weeks ago is wrong, and Musalem brought a decomposition: roughly half the excess inflation is persistent demand, not supply. Warsh’s breadth metric has 55% of the PCE basket running above 3%. The counter is sitting in the inflation data that needs to looked at:
Core CPI is at 2.4% and falling. It’s below its fifty-year average and a full point below the headline print. The gap between the two is the oil shock, and it is isolated and measured. Core PCE is running 60 basis points hotter than core CPI, and that’s backward. CPI normally prints above PCE because of how it weights shelter. Hawks are building a breadth case on the hotter of the two measures, and the BEA re-specified it five weeks ago in the components where it diverges most. Pick CPI instead of PCE, and the entire argument changes sign. That’s not a small thing to leave unsaid!
Noisy payroll numbers
I pulled the last NINE releases to see how the first prints hold up:
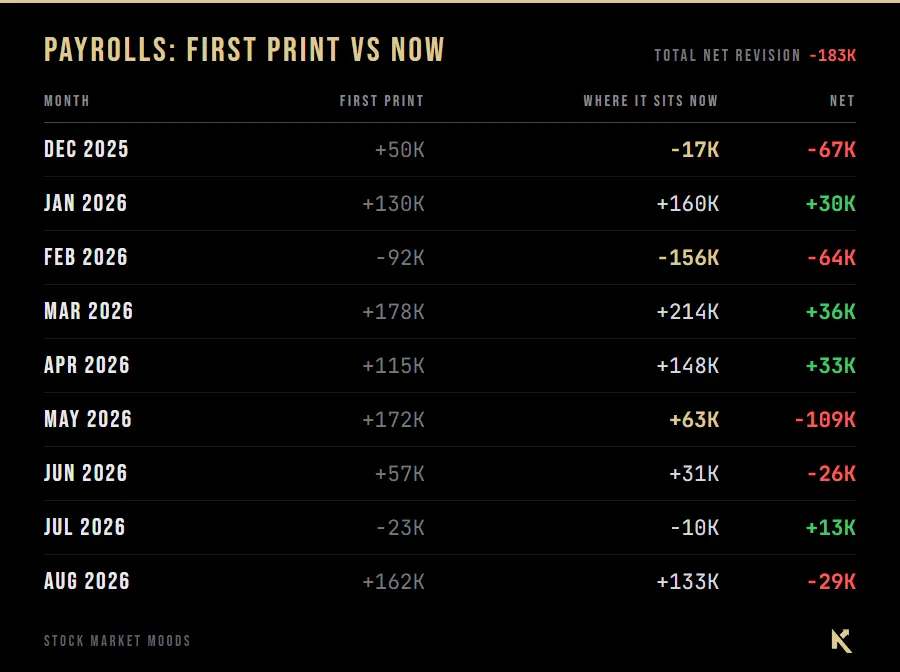
Five revisions down, four revised up, so there’s no clean directional bias. The asymmetry is in the size. Downward revisions average 59,000, and upward revisions average 28,000. When the first print is too optimistic, it’s typically wrong by twice as much.
The average absolute revision is 45,000. The average monthly job gain over the past twelve months is also 45,000. The noise is the same size as the signal, and BLS itself puts the threshold for a statistically significant monthly change at about 122,000. This would make Friday’s 29,000 somewhere between -60,000 and +90,000, and we will know in December.
Q1 averaged 73,000. Q2 averaged 81,000. Q3 averaged 51,000.
The economy needs to add roughly 80,000 jobs a month just to keep the unemployment rate flat, because that’s about how fast the labor force is growing. Fed Governor Barr has been using that figure. Q3 is well under. Three of the last ten months are now negative, including February at -156,000, which nobody remembers because it printed at -92,000 and got marked down after the market moved on.
The breadth under friday’s jobs report
Aggregate weekly hours were flat, 0.0% on the month. The workweek held at 34.4, and total labor input didn’t grow at all. The private diffusion index fell to 49.0 from 57.6. That’s the share of 250 industries adding jobs, and below 50 means more than half cut. It’s the first sub-50 reading of 2026, after spending the entire year between 50.8 and 57.6. Manufacturing diffusion collapsed from 63.9 to 46.5.
The gain wasn’t broad and small; it was narrow. Health care added 17,000, down from a twelve-month average of 33,000. And its the one engine that has carried this expansion running at half speed, because nursing and residential care shed 9,000 jobs. Temp help fell 10,900 and JOLTS openings dropped 256,000 to 7.08 million, so demand for new workers is shrinking. On the other side, job losers fell 45,000, initial claims sit at 197,000 and continuing claims at 1.701 million, so firing isn’t happening either.
That’s the low-fire, low-hire market in a single month. Almost nobody is being let go, and almost nobody is being brought on. It’s a decent place to be if you already have a job and a terrible one if you don’t, which is why the long-term unemployed are now 27.1% of everybody out of work.
One number I don’t like: Black unemployment jumped a full point to 7.0%. Teen unemployment went to 14.5%. Both are volatile monthly series and neither deserves a thesis on one print. Marginal-worker unemployment turning up first is the historical pattern, and bachelor's-degree unemployment fell to 2.5% in the same month.
Credit broke
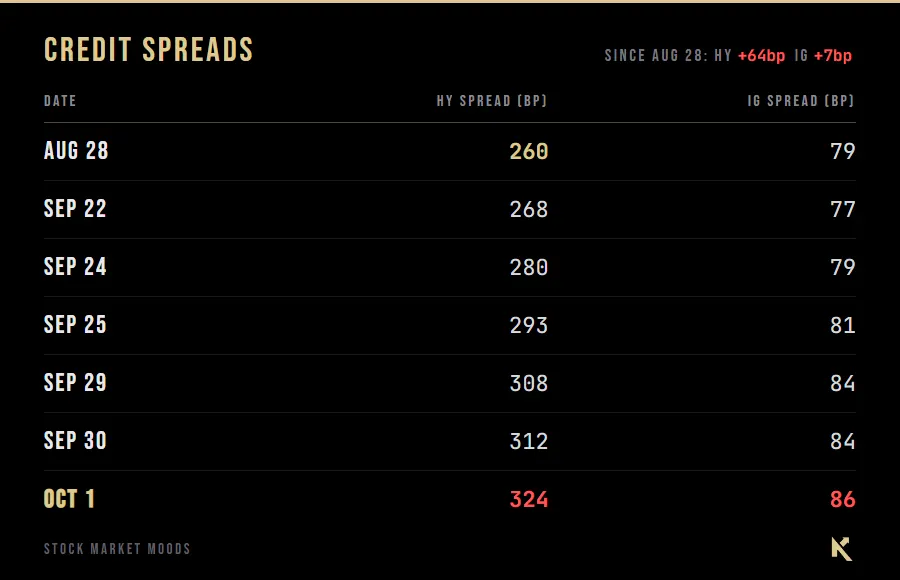
Now back to where we started. High-yield spreads sat flat in a 265 to 276 range for the first three weeks of September. Then seven consecutive sessions of widening with no pause. Investment grade moved 9 basis points over the identical window. High yield moved 56. The ratio between them went from 3.48 to 3.77.
This matters because it tells you what kind of move this is. A pure risk-free rate move widens both proportionally or neither. Low-quality widening six times faster than high-quality is the market repricing credit risk, not duration. But you have to adjust for duration first. Duration measures how much a bond fund’s price moves when rates change, expressed in years. LQD carries about 8.5 years against 3.4 for HYG, which means a one-point rise in rates costs LQD about 8.5% and HYG about 3.4%. On a pure rates move, LQD should be down roughly two and a half times as much as HYG, and it isn’t!
Narrow it to the last month and it’s starker. HYG fell more in absolute price terms than LQD, carrying 40% of the interest rate risk. There’s no rates explanation for that. HYG closed Friday at 76.91, below its key moving averages, with the 50 under the 200 since midyear. That is worth being precise about what’s new here, because borrowing costs themselves aren’t.
What a company actually pays is the Treasury yield plus the spread, and the Treasury part has been climbing all year. As of September 30, investment-grade borrowers were paying an all-in 6.0%, the 88th percentile of the last 25 years, while their spread sat at the 5th percentile. High yield was paying 8.3%, about its 25-year average of 8.0%, on a spread in the 17th percentile. Those two facts only coexist when the risk-free rate is doing all the work.
So the cost of corporate money has been rising for months, and until September 23, none of it was about credit. What changed is that spreads started adding to the bill. Borrowers now get it from both directions.
Now, the part that keeps me honest about all this. 324 basis points is still historically tight. The 25-year average is 498. At current levels, high yield sits somewhere around the 19th percentile of the last quarter century, 174 basis points inside its own average. Nobody is being denied financing at 324 over. No issuer is in trouble. And some of the tightness is earned rather than complacent. The high yield index is 54% BB and 7% CCC today, against 32% and 15% in December 2007. It’s a structurally better index than the one those historical averages were built on. The risk isn’t where spreads are. It’s where they came from. The August 28 reading of 260 was the second tightest print in three years, with exactly one day tighter in the whole series. High yield entered September with no cushion at all, and there’s 174 basis points of room between here and merely normal.
Who is actually paying
We have to look at equity breadth. 24.65% of the S&P is above its 50-day. 42.54% is above its 200-day. In a healthy trend the 50-day figure runs above the 200-day figure, because short-term momentum leads. An 18-point inversion means roughly 90 names have broken their short-term trend in the past two or three months while still sitting above their long-term one. Those 90 are the queue.
On Friday, 69 names hit new 52-week lows versus 29 new highs. And Friday was an up day.
The S&P closed at 7,722.72, up 0.73%, within 1.2% of its 52-week high of 7,816.70. The Nasdaq 100 closed at 30,807.93, up a full percent at a fresh all-time high, with Nvidia at a record. The Russell 2000 rose 0.94% to 2,832.89, and the Dow added 0.49% to 51,176.96.
So the index rallied on the weakest payroll print of the year, a point away from a record, while three quarters of its members sat below their 50-day and the last published credit reading had widened another 12 basis points the day before. Sub-25% breadth readings normally show up at washout lows.
The sector table explains it:
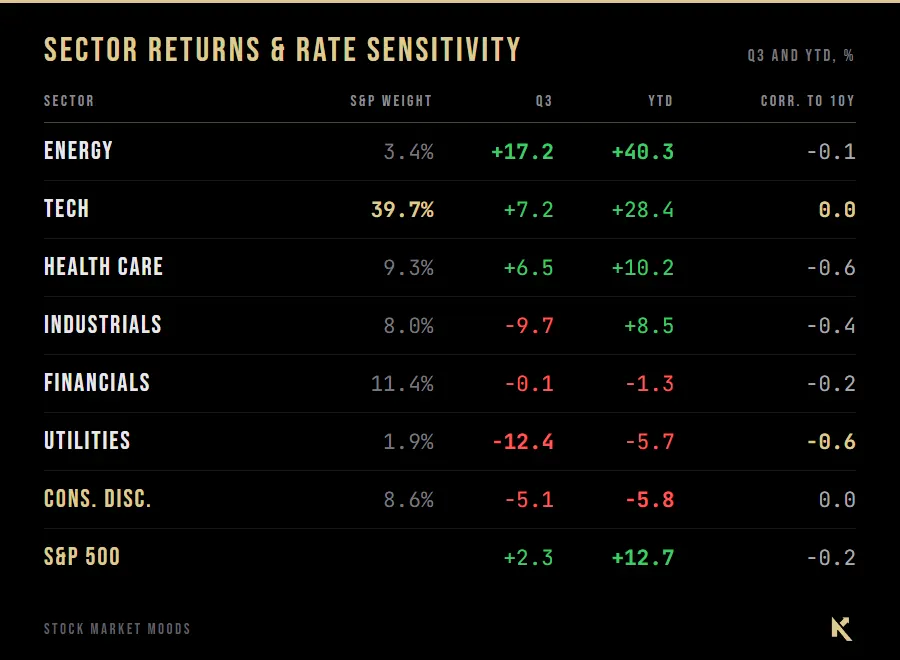
Technology is 39.7% of the index and up 28.4%, which is roughly eleven points of the S&P’s 12.7% total return. One sector is doing nearly all of the work. That’s not a mania, it’s arithmetic. Look at the last column, which measures how a sector moves when the 10-year yield moves. A reading of -0.6 means the sector reliably falls when yields rise. A reading of 0.0 means yields don’t move it at all.
Utilities, Real Estate, Health Care, Staples and Materials all sit at -0.6. Technology sits at 0.0. So when long-term rates make new highs, there’s exactly one sector big enough to absorb the money leaving everything else, and it happens to be the one sector rates don’t touch. Utilities down 12.4% in a quarter is the other side of the trade.
And here’s the finding that cuts against the consensus. The ten largest companies are 40.6% of market cap and 36.1% of earnings, trading at 20.9x forward against their own historical average of 20.8x. That’s 100% of normal. The other 490 trade at 17.9x against a 16.0x average, which is 112% of normal.
The expensive part of this market isn’t the Magnificent 7. It’s everything else. The narrowing everybody complains about is rising yields slowly deflating the other 490, and the mega caps are the only group paying a normal multiple for the earnings they actually have.
The six-to-one tax
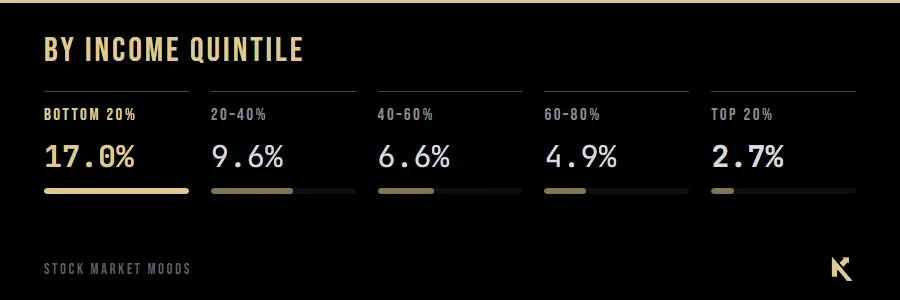
Energy up 40.3% and Consumer Discretionary down 5.8% are the two ends of one trade. Here’s the mechanism, from the 2024 BLS Consumer Expenditure Survey. Energy spending as a share of income, by pre-tax income quintile:
Now put it next to who earns and who spends:
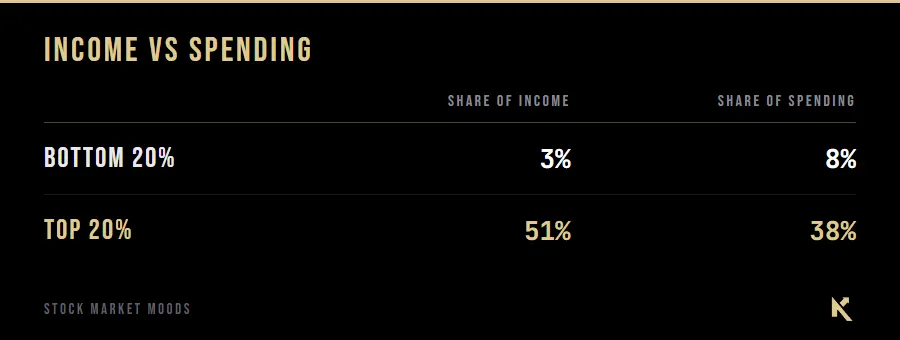
The bottom quintile earns three percent of national income and accounts for eight percent of consumption. They were already spending beyond what they earn before oil moved. Then the energy bill arrived on 17% of their income.
An oil shock is a regressive tax with a six-to-one gradient, landing on the cohort that was already dissaving. That’s why “transitory” is a harder sell than the economics suggests. Transitory means something different when it’s a sixth of your paycheck.
Nike reported into exactly this on Thursday. Revenue down 4%. Greater China down 26% once you strip out currency moves. North America up 2%. Their own website and app down 13%. Converse down 28%. Wholesale, which is what they sell through full-price retail partners, down only 1%.
So the cheaper brand and the discount-hunting channels took the damage while the full-price channel held. That’s the K-shape inside a single company’s income statement. The stock closed Friday at a fresh 52-week low of $33.05.
Fiscal 2027 guidance is for revenue to decline high single digits, with adjusted EPS of $1.15 to $1.35 against $0.48 earned in the first quarter alone. They’re guiding earnings to roughly halve sequentially and stay there.
The delinquency data says the same thing. Credit cards at 8.7% and auto loans at 7.9% flowing into 30-day delinquency, against mortgages at 4.0%. Mortgage debt is 67% of all household liabilities and it’s the healthiest line, because it sits with the top quintile at locked-in rates. The stress is in the credit types the bottom 60% actually use.
Meanwhile, cumulative net worth growth since the end of 2019: top 20% up $58 trillion, bottom 80% up $19 trillion.
Aggregate consumer balance sheets are fine. The household debt service ratio is 11.1%, well under the 15.8% peak in 2007. Both of those things are true, and both of them matter, and neither one helps the bottom quintile.
Why the long end won’t sit still
Fiscal 2026 federal spending was $7.4 trillion against a $1.853 trillion deficit. Twenty-five cents of every federal dollar is borrowed. Net interest is now $1.039 trillion. Defense is $885 billion. Interest on the debt exceeds the entire defense budget by $154 billion and absorbs 14% of all federal spending. Federal net debt goes from 99.4% of GDP last year to a projected 120.2% by 2036 on the CBO’s baseline.
That’s why a 29,000 payroll print couldn’t rally the 30-year. Every basis point at the long end compounds into the fastest-growing line in the federal budget, and the market can read a refinancing calendar.
One detail worth noting while we’re here: customs duties brought in $418 billion, now a larger federal revenue line than corporate income taxes at $404 billion. Tariffs have quietly become the fourth largest source of federal financing.
What argues against all of this
Four items deserve attention.
The United States is a net petroleum exporter. Net imports of petroleum products ran negative 0.6% of GDP in the second quarter. In the 1970s this was 3 to 4% of GDP. An oil shock no longer drains national income the way it used to. It redistributes it, which is precisely what Energy at +40.3% and Consumer Discretionary at -5.8% describes. This is the strongest version of the look-through case and it’s correct at the aggregate level. The rebuttal is distributional, and it’s the 17% number.
Consumer sentiment is at 48.1 on the Michigan index against a long-run average of 77.2. JPMorgan marks it as a cycle trough, and the average subsequent twelve-month S&P return from nine prior sentiment troughs is +24.1%, against +4.8% from sentiment peaks. Caveat: you only know a trough after a series of higher highs, so calling September a trough right now is a forecast wearing an observation’s clothes. The base rate is still the base rate.
Spreads are still tight and the index is better than it used to be. 324 basis points at the 19th percentile is not distress. It’s the first increment.
The G7 just dropped an intervention the size of the problem on it. One hundred million barrels of diesel released immediately, with more under discussion. Put that next to total US distillate inventories of 105.2 million barrels and you see the scale of what they did. Policymakers don’t tap distillate reserves at that magnitude unless they think the squeeze is serious, which validates the thesis, and an intervention that large should compress refined-product cracks hard, which could end it.
There’s already an early sign of that. Diesel fell 14.7 cents last week, the sharpest weekly decline in a while, against gasoline’s 1.3 cents. The peak may be in. If diesel keeps coming down through October, the distillate story gets dated fast and the Fed’s base-effect forecast starts looking right on both rows.
Cutting the other way, the administration rejected an Iranian proposal to reopen the Strait of Hormuz last weekend, which makes part of the constraint a policy choice rather than an accident. And the crude buffer is largely spent: the Strategic Petroleum Reserve holds 283.8 million barrels against 406.7 a year ago, down 30%. There’s less ammunition left than there was.
What i’m watching
High yield spreads. The ICE BofA series through Thursday is 324. Friday’s reading posts Monday, and HYG closed near its low, so expect another leg. If this keeps widening, financing costs rise for exactly the leveraged employers who hire out of the bottom of the K, and Friday’s 29,000 isn’t the floor. If it stalls here, this stays a rates event the real economy mostly rides out.
The first Fed official to react to the jobs report. Nobody has. Logan spoke Friday at a migration research conference and said nothing about policy. The market repriced from 50/50 to 18% entirely on its own, and the last things anyone on the committee said publicly were Goolsbee and Musalem arguing the other direction. Whoever speaks first next week sets the tone into October.
The 50-day breadth number. At 24.65%, either it turns up or the 42.54% follows it down. Those 90 stocks sitting between the two lines are the ones that decide it.
Diesel, every Monday. EIA posts the national on-highway average and the weekly inventory draw. If the G7 release does its job, diesel comes off $6.38 and distillate stocks stop falling, and a good chunk of the hawkish case goes with it. If stocks keep drawing at 15% below last year into November, the heating season does the rest.
Earnings, starting October 13 with the banks. The FactSet estimate for Q3 S&P 500 earnings growth is 29.1% and still rising.
On valuation, the index trades at 19.0 times next year’s expected earnings against a thirty-year average of 17.2. That alone isn’t alarming. The number that is: flip the multiple over and you get the earnings yield, which is what the index earns for every dollar you pay. It now sits a full percentage point below what investment grade companies pay on their bonds, when historically it runs seventy basis points above. A 170 basis point swing from normal.
Put plainly, stocks now pay you less than corporate bonds do, which almost never happens. That’s what makes 19 times earnings against a 5.3% ten-year a very different proposition from 21.4 times against a 1.6% ten-year in January 2022.
The Atlanta Fed cut its Q3 GDP nowcast from 5.0% to 3.7% this week on consumer spending and net exports. That’s an enormous markdown to a number that’s still hot.
The argument
Strip it down.
The Fed decided in September that it would look through an oil shock. The market spent three weeks deciding whether to believe that, and this week it stopped asking. Hike odds at 18% mean the market is now certain the Fed will be patient.
Patience has a price and the market has started charging it. The 30-year at a cycle high is the first installment. Credit widening 56 basis points in seven sessions is the second. Rising long yields then do the tightening the Fed declined to do, except they do it with no control over the distribution. The rate-sensitive sectors eat it, breadth falls to 24.65%, and the money that leaves piles into the one sector with zero yield sensitivity, which is why the Nasdaq 100 printed a record on the same day 69 stocks made 52-week lows and Nike hit a one-year low on its earnings report.
Underneath all of it, the energy bill lands at 17% of income on the bottom fifth and 2.7% on the top fifth.
The committee’s forecast says this resolves by itself: inflation back to 2.3% next year, unemployment at 4.1% through 2029, nobody hurt. Maybe. Two of their own presidents don’t think so, core CPI at 2.4% says the hawks are measuring with the wrong ruler, and the bond market settled the dispute without waiting for either side, by charging extra to lend long and moving on.
The Fed’s patience is being financed by the bond market. The question on October 28 isn’t whether they hike. It’s who ends up paying the bill, and the first page of that answer showed up in credit spreads on September 23.
Brian Stock Dads
Published October 4, 2026. Nothing here is investment advice. I'm not a licensed financial advisor and this is market commentary, not a recommendation to buy or sell anything. Index levels, yields and breadth are as of the close on October 2, 2026. High yield and investment grade spread data run through October 1, the most recent published readings. Crude is as of Sunday, October 4. Valuation figures are as of September 30. Do your own work and size your own risk..
Trade alongside our analysts
Join the 1%